The problem
The firm advises credit unions on mergers and capital. Its edge was a screening heat map: a spreadsheet that pulled ratios from the NCUA 5300 Call Report for a shortlist of institutions and ranked them on the partners’ own composite score. It worked, and it was slow. Every quarter someone re-downloaded the regulator’s data, re-pasted it, and re-checked the formulas. Coverage was limited to the institutions someone had already thought of.
What we built
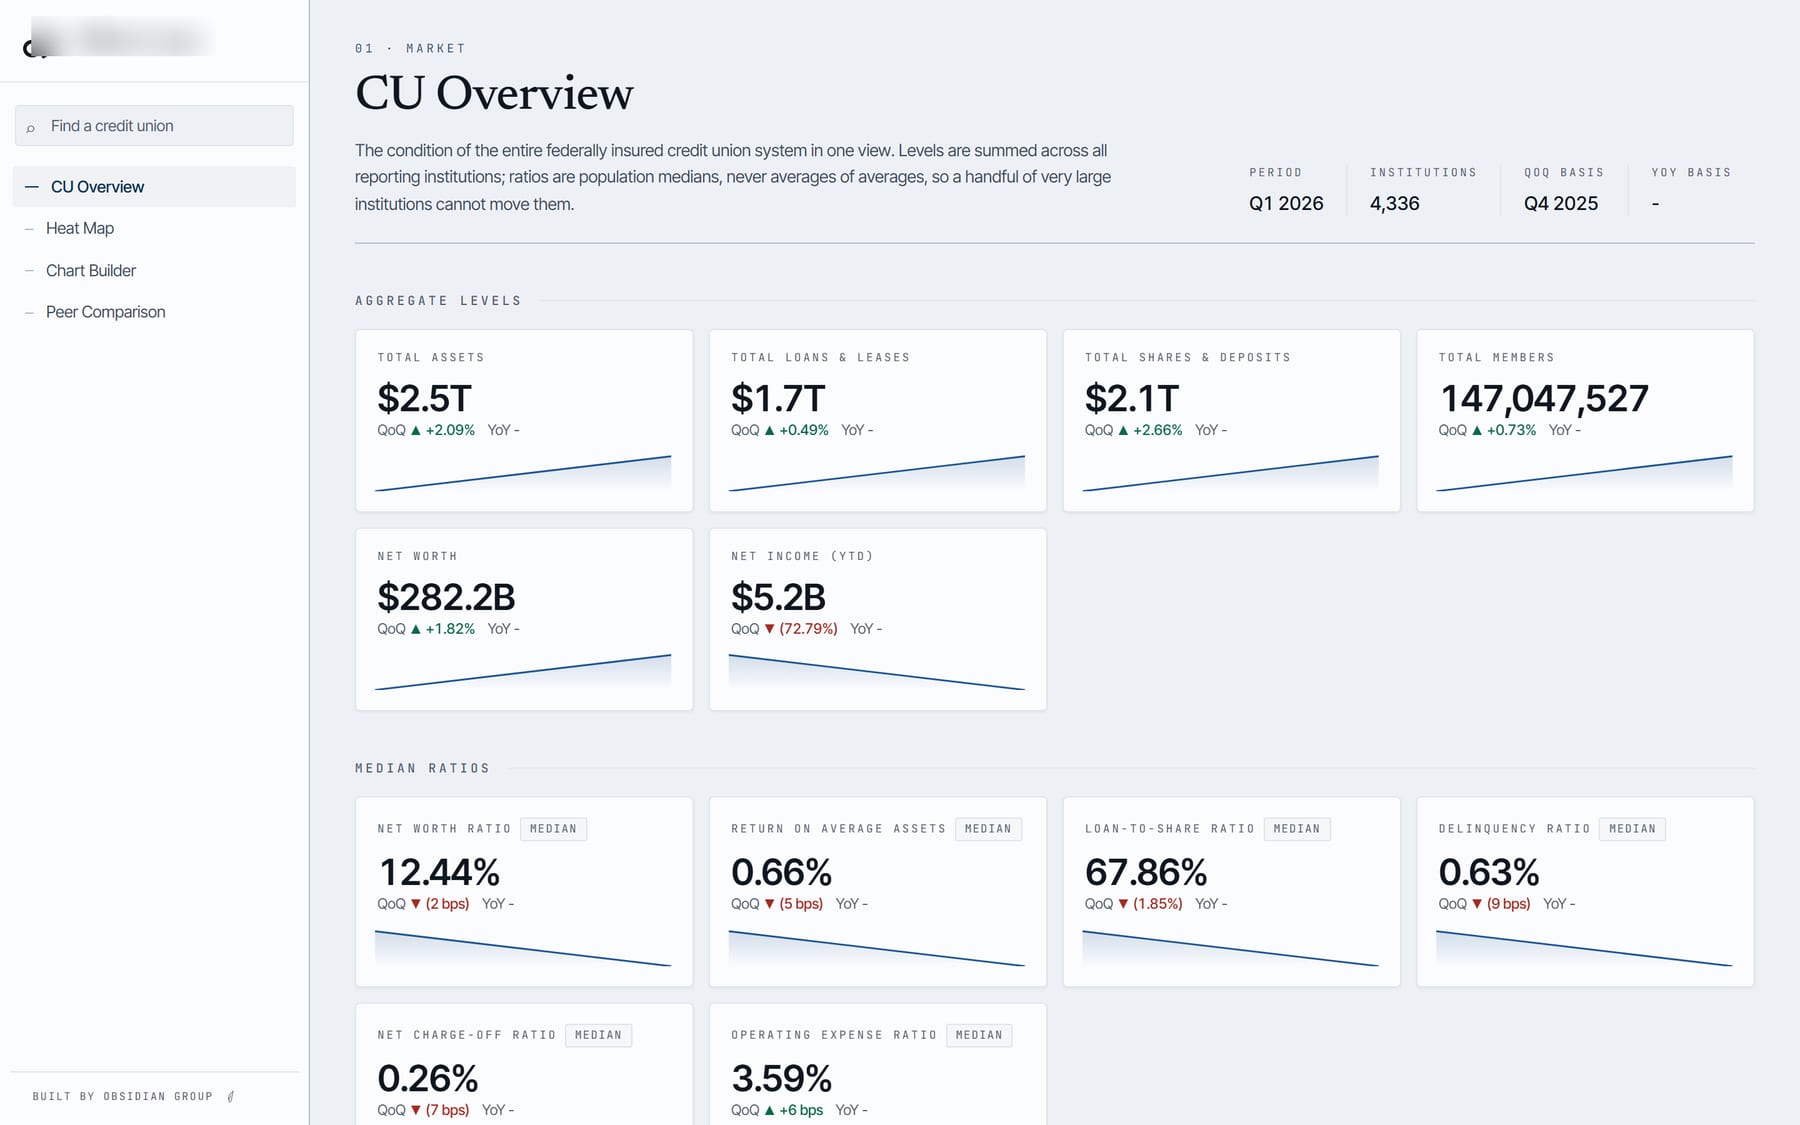
A screening platform over the full universe of federally insured credit unions, updated from the regulator’s quarterly releases.
- A long-form fact store. The regulator publishes roughly twenty wide tables per quarter with about 3,400 account codes. We melt them into one fact table, keep every account definition versioned, and record each ingestion so a changed column never silently changes a number.
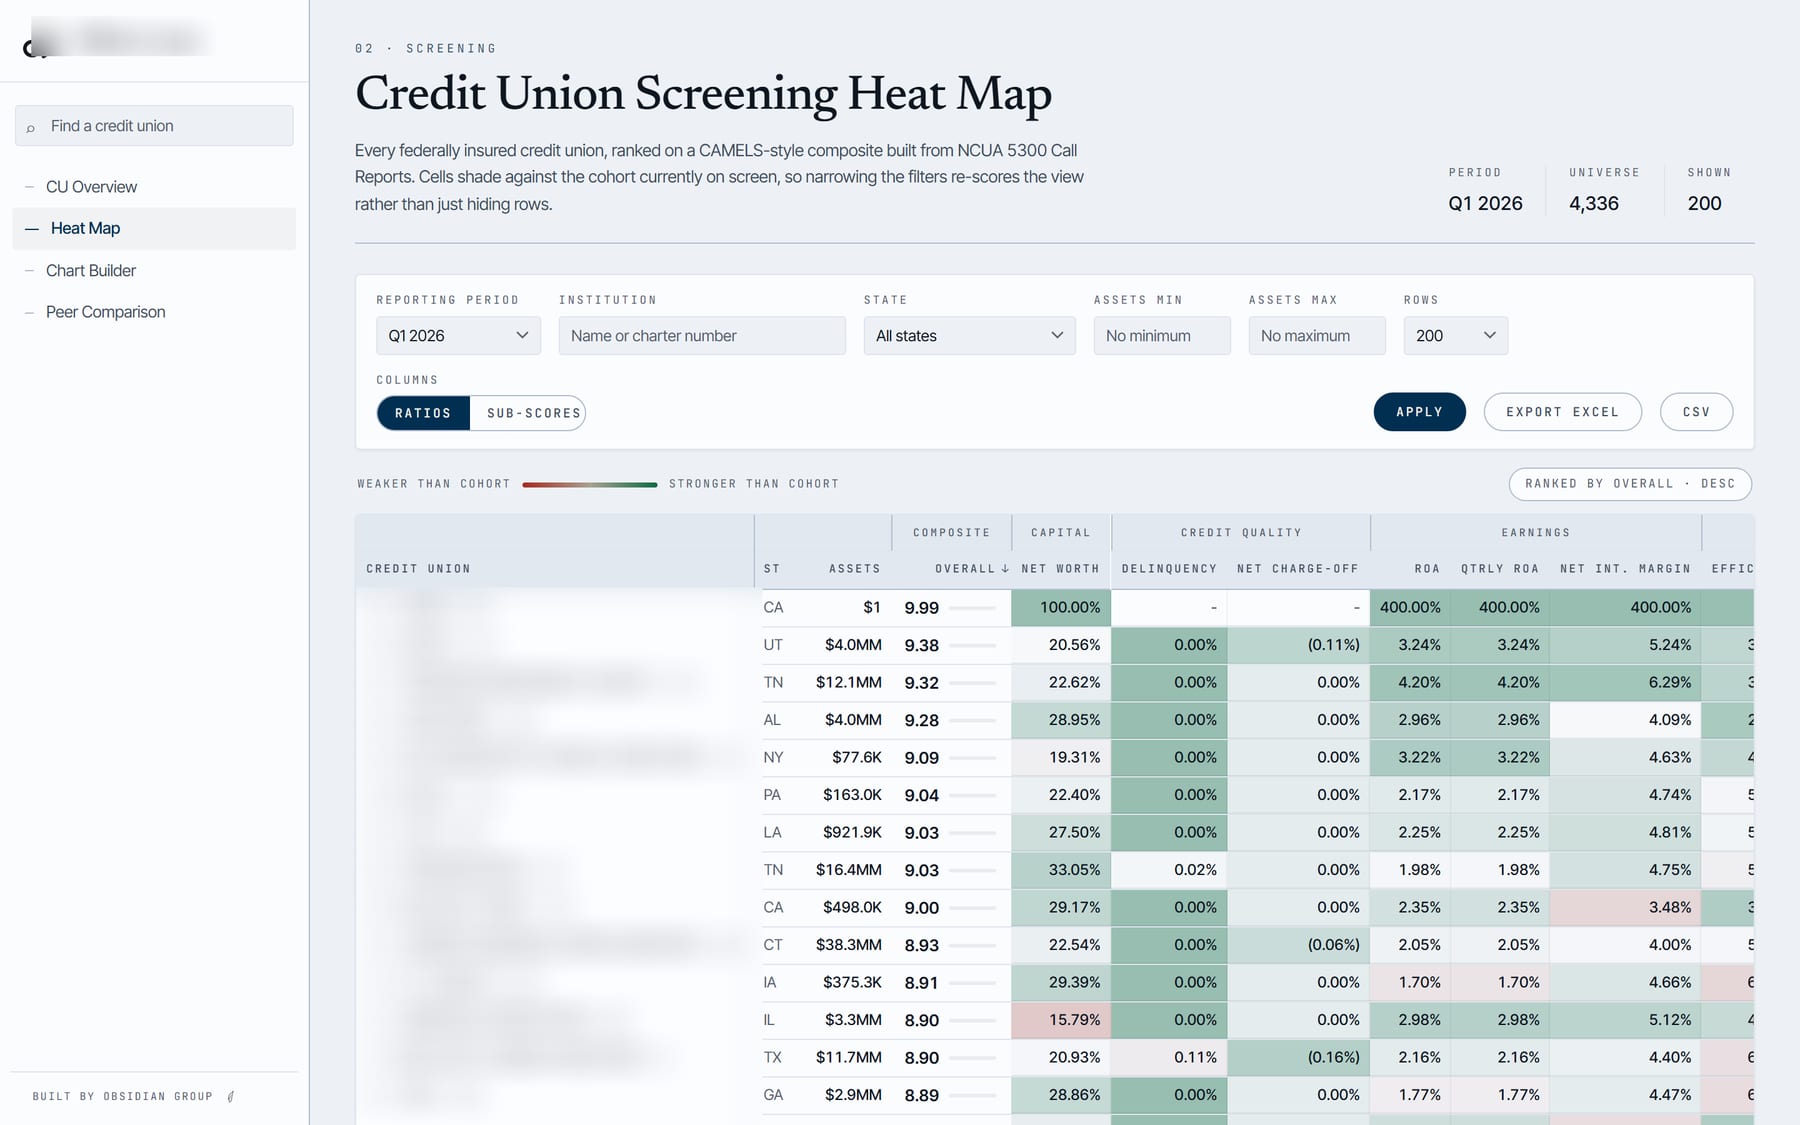
- The firm’s own metrics. Twenty-six derived ratios from the regulator’s financial performance report, plus the partners’ composite score, percentile-ranked across the universe. Every ratio was reconciled against the firm’s existing reports before it went live.
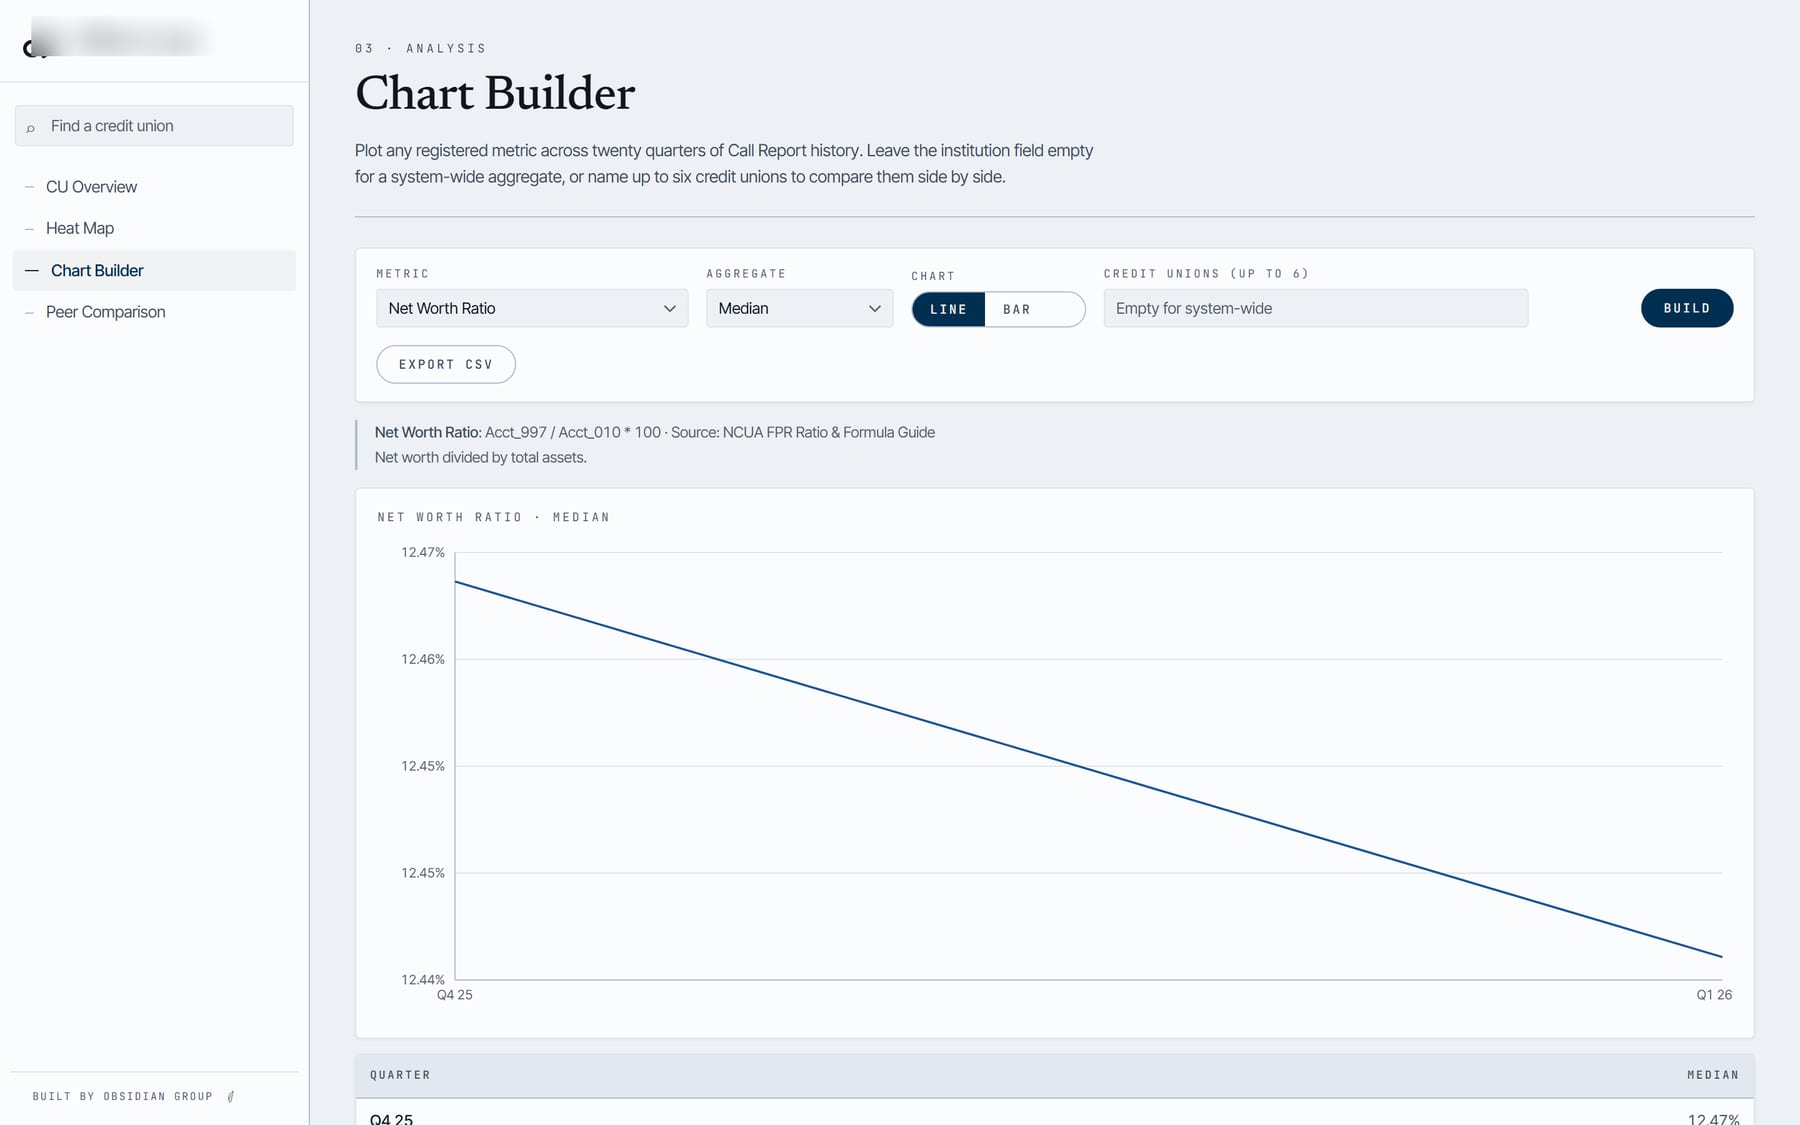
- The heat map, as a product. Filter by state, asset band, and any metric, then see the full universe ranked. Peer sets, per-institution drill-down, and the raw account series behind every number.
- Full history in a warehouse. All twenty quarters, about 296 million facts, loaded into BigQuery and clustered so a single institution’s drill-down scans a fraction of a percent of the table. Storage runs under a dollar a month.
How it went
The first version was deployed within days of kickoff. The full twenty-quarter history, authentication, and the warehouse followed in the first week. The platform runs on the firm’s own cloud project, behind access codes, with a same-origin API so nothing is exposed that does not need to be.
What the client got
Coverage of every institution instead of a shortlist. Quarterly refreshes that take minutes instead of a day. A score that is finally consistent because it is computed once, not retyped. And a system the firm owns and can extend.
A white-labeled version of the same platform is available as a private preview for other advisors and institutions working with credit union data. Ask us about it.